Bering-uClibc 5.x - User Guide - Advanced Topics - Setting Up Remote Monitoring
| Advanced Topics - Setting Up Remote Monitoring | ||
|---|---|---|
| Prev | Bering-uClibc 5.x - User Guide | Next |
Contents
Objectives
We assume here that you wish to monitor some operational parameters of a Bering-uClibc system. The parameters of interest will vary depending on the precise usage of the system but might include:
- Network traffic bandwidth through each network interface.
- Round-trip network latency to different destinations.
- CPU utilization.
- Disk utilization.
- CPU and Motherboard temperatures.
We also assume you wish to use a separate machine as the Network Management Station, which is responsible for collecting and presenting the operational parameter data.
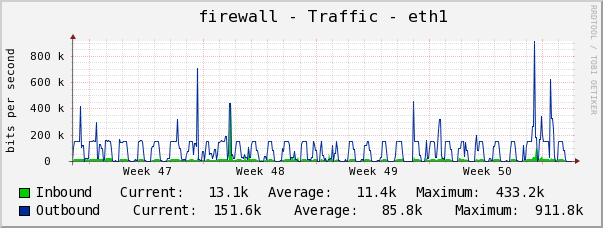
An example of network traffic bandwidth monitoring is the following graph, generated by the Cacti application.
The overall solution consists of three main components:
- Some means accessing the operational parameter data.
- Some means of communicating this data to the Network Management Station.
- Some means of storing, displaying or otherwise reporting on the data.
Accessing the Data
For "standard" parameters this is covered by the next section, since the tools which Communicate the data are also responsible for accessing the parameter values.
For non-standard parameters it is necessary to do something more specific. Generally this is achieved by implementing a program/script which returns the parameter data in a very simple form - e.g. printing a number to stdout.
Hardware Sensors
Many CPUs and motherboards include temperature sensors, fan speed sensors or other sensors which can be queried using the lm-sensors utilities.
Packages
For Bering-uClibc 5.x the lm-sensors utilities can be installed by loading the following Packages:
-
sensors.lrp -
libsens.lrp -
perl.lrp(only for running "sensors-detect", see below)
Modules
You probably need to load Modules for:
- Your system's i2c interface hardware
- Your hardware sensor(s)
The precise Modules required will depend on your hardware.
Automatic Sensor Detection
If you do not know what sensor hardware is installed (and what kernel Module(s) are required) there is a Perl script /usr/sbin/sensors-detect which can scan your system and try to identify any sensors found.
This script relies on the presence of an i2c device file which is implemented by kernel Module i2c-dev.ko.gz so this should be loaded before running the script.
If the script finds a sensor it will tell you what it is and which kernel Module needs to be loaded.
Sensors Command
With the lm-sensors Packages installed and the necessary kernel Modules loaded, the sensors command should display some values. The following example is from an ALIX2D13 board:
# sensors
lm86-i2c-0-4c
Adapter: CS5536 ACB0
temp1:        +36.0 C  (low  =  +0.0 C, high = +70.0 C)
                       (crit = +85.0 C, hyst = +75.0 C)
temp2:        +41.1 C  (low  =  +0.0 C, high = +70.0 C)
                       (crit = +85.0 C, hyst = +75.0 C)
Simplified Output
The output from the sensors command can be simplified by using a shell script containing the following:
sensors | grep "[Tt]emp" | awk -F: '{print $2}' | tr '+' ' ' | awk '{print $1}'
For the above example, this prints simply:
36.0
41.1
which is more suitable for further processing.
Communicating the Data
Using SNMP
While there are several alternative approaches, the preferred solution in many cases is to use the Simple Network Management Protocol (SNMP) to let a remote Network Management Station (NMS) access operational parameters on the Bering-uClibc system over the (internal) network.
TODO: Add details of installing and configuring the SNMP Packages. Copy (some) content from http://leaf.sourceforge.net/doc/bucu-rrdtool.html.
Using Specific Agent Software
An alternative to using the industry-standard SNMP protocol is to install a specific monitoring Agent daemon and to use whatever communications protocol that implements to transfer data to a compatible NMS system.
Zabbix
Zabbix is an Enterprise-Class Open Source distributed monitoring system. See the Zabbix Home Page for further information.
Two Zabbix Packages are available for Bering-uClibc:
-
zbxagent.lrpwhich installs the Zabbix agent (zabbix_agentd) and related configuration files. -
zbxutil.lrpwhich installs thezabbix_getandzabbix_senderutilities.
Reporting On the Data
A key benefit of using SNMP as the data communication mechanism is that any one of a number of different applications can be used to collect and report on the results. Since these run on other platforms they are not a focus for this Bering-uClibc documentation, but some brief notes are included below.
- The Nagios system is popular. This has a focus on status reporting and alerting and is less oriented towards performance monitoring and graphing.
- The RRDTool system is the leading Open Source solution for logging and graphing time-varying data. This can be used "raw" but is more often used within one of the other systems which provide management tools and an administration user interface.
- The Cacti application is built on top of RRDTool and has a focus on collecting and graphing time-varying data.
A discussion of the pros and cons of these and other solutions can be found here.
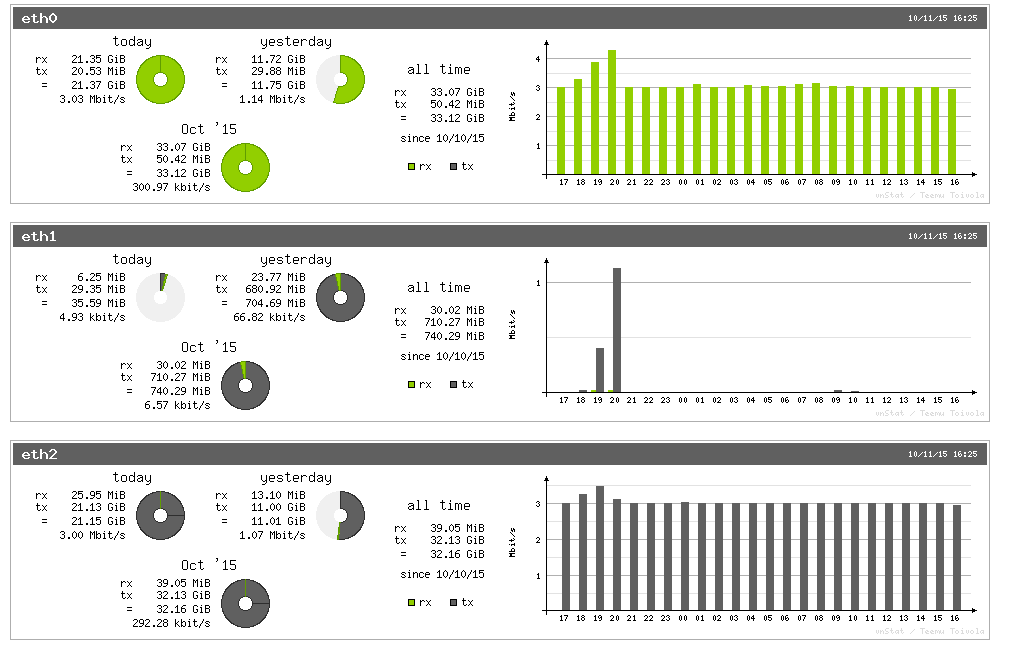
Monitoring traffic with vnstat and lighttpd
Another solution to remote monitoring traffic is vnstat and the lighttpd browser. In opposite to the default mini_httpd webserver, which mainly provides access to the Web Configuration, lighttpd is capable to use cgi scripting.
Please note: The following description replaces mini_httpd with lighttpd, so the Web Configuration will not be accessible any longer.
Installing required Packages
To install the required Packages, add vnstati and lighttpd to the list of Packages to load in leaf.cfg. Other Packages needed (libgd.lrp, libssl.lrp, libpcre.lrp, vnstat.lrp, libiconv.lrp, libpng.lrp and libgd.lrp) will be installed automatically. Don't forget to remove the webserver mhttpd from leaf.cfg, since this one will conflict with lighttpd.
Configure lighttpd
To enable remote traffic monitoring with vnstat, you'll need to enable the module mod_alias and mod_cgi in /etc/lighttpd/modules.conf.
server.modules = (
 "mod_access",
 "mod_alias",
#  "mod_auth",
[...]
##
## plain old CGI (mod_cgi)
##
include "conf.d/cgi.conf"
Edit /etc/lighttpd/conf.d/cgi.conf to configure the cgi module:
alias.url += ( "/cgi-bin" => server_root + "/cgi-bin" )
$HTTP["url"] =~ "^/cgi-bin" {
   cgi.assign = ( "" => "" )
}
Configure vnstat
vnstat tracks traffic information for all available and accessible network interfaces out of the box.
To make all accessible interfaces visible in the web browser add the interfaces in /var/www/cgi-bin/vnstat.cgi e.g:.
# shown interfaces, remove unnecessary lines
my @graphs = (
        { interface => 'eth0' },
        { interface => 'eth1' },
        { interface => 'eth2' },
        { interface => 'wlan0' },
Accessing the data
Point your local web browser to vnstat.cgi on your router:
http://192.168.1.254/cgi-bin/vnstat.cgi
You may need to adjust the IP address above with the one of your router. If everything works, you'll see the traffic statistics.
| Prev | Up | Next |

